Prometheus + Grafana on Amazon Linux2
前回に引き続きGrafanaを構築します Prometheusとfluentdは前回のものを参照してください
構成
- Amazon Linux2
- Prometheus 2.8.0
- fluentd 1.3.3
- Grafana 6.4.2-1
Grafana インストール
Download Grafanaを参考にインストールします
$ curl https://dl.grafana.com/oss/release/grafana-6.4.2-1.x86_64.rpm -O$ sudo yum localinstall grafana-6.4.2-1.x86_64.rpm直接yum installしても大丈夫です
$ sudo yum install https://dl.grafana.com/oss/release/grafana-6.4.2-1.x86_64.rpmsystemctl設定も作成してくれていますので起動するだけで良いです
$ sudo systemctl start grafana-server.serviceデフォルトでは3000番PortをBindするようになってます
見る頻度が高い画面だと思うのでNginxを前段に立てるようにします
behind_proxyの手順で進めます
Nginx reverse proxy設定
NginxはAmazonが提供しているものを利用します
$ sudo amazon-linux-extras install nginx1.12HTTPS化する為、Let’s EnctyptかALBを噛ますか迷ったのですが、
料金を増やしたく無いのでLet’s Enctypt対応することにしました
まずは amazon-linux-extras 経由で epel repository追加して certbot 入手します
$ sudo amazon-linux-extras install epel$ sudo yum install certbot python2-certbot-nginxSecurityGroupにて接続できるIPを制限してるのでDNS経由での認証を行います
hoge.seike460.comは適宜読み替えてください
$ sudo certbot certonly --preferred-challenges dns-01 --authenticator manual --domain hoge.seike460.comSaving debug log to /var/log/letsencrypt/letsencrypt.logPlugins selected: Authenticator manual, Installer NoneObtaining a new certificatePerforming the following challenges:dns-01 challenge for hoge.seike460.com
- - - - - - - - - - - - - - - - - - - - - - - - - - - - - - - - - - - - - - - -NOTE: The IP of this machine will be publicly logged as having requested thiscertificate. If you're running certbot in manual mode on a machine that is notyour server, please ensure you're okay with that.
Are you OK with your IP being logged?- - - - - - - - - - - - - - - - - - - - - - - - - - - - - - - - - - - - - - - -(Y)es/(N)o: y
- - - - - - - - - - - - - - - - - - - - - - - - - - - - - - - - - - - - - - - -Please deploy a DNS TXT record under the name_acme-challenge.hoge.seike460.com with the following value: !!! このTXTレコードを !!!
XxxxxxxxxxxxxxxxxxxxxxxxxxxxxxxxxxxxxxxxxxX !!! これをValueで作成 !!!
Before continuing, verify the record is deployed. !!! ここでDNS設定を行った後にEnter !!!- - - - - - - - - - - - - - - - - - - - - - - - - - - - - - - - - - - - - - - -Press Enter to ContinueWaiting for verification...Cleaning up challenges
IMPORTANT NOTES: - Congratulations! Your certificate and chain have been saved at:   /etc/letsencrypt/live/hoge.seike460.com/fullchain.pem   Your key file has been saved at:   /etc/letsencrypt/live/hoge.seike460.com/privkey.pem   Your cert will expire on 2019-06-15. To obtain a new or tweaked   version of this certificate in the future, simply run certbot   again. To non-interactively renew *all* of your certificates, run   "certbot renew" - If you like Certbot, please consider supporting our work by:
   Donating to ISRG / Let's Encrypt:   https://letsencrypt.org/donate   Donating to EFF:                    https://eff.org/donate-le
よく見ると寄付リンクあったので寄付してみました
感謝を伝えたい方は是非 ↓
Donating to ISRG / Let’s Encrypt
この証明書をありがたく使います
$ sudo vim /etc/nginx/nginx.conf画像などはキャッシュさせながら80 -> 443にリダイレクトしてます
http {
    ~ 省略 ~
    server {        listen 80;        server_name hoge.seike460.com        return 301 https://$host$request_uri;    }
    server {        listen       443 ssl http2 default_server;        server_name  hoge.seike460.com;        root         /usr/share/nginx/html;
        ssl_certificate "/etc/letsencrypt/live/hoge.seike460.com/fullchain.pem";        ssl_certificate_key "/etc/letsencrypt/live/hoge.seike460.com/privkey.pem";        ssl_session_cache shared:SSL:1m;        ssl_session_timeout  10m;        ssl_ciphers HIGH:!aNULL:!MD5;        ssl_prefer_server_ciphers on;        ssl_protocols TLSv1.2;
        include /etc/nginx/default.d/*.conf;
        proxy_set_header X-Real-IP  $remote_addr;        proxy_set_header X-Forwarded-For $remote_addr;        proxy_set_header X-Forwarded-Proto $scheme;        proxy_set_header Host $host;
        location ~* .(ico|jpg|png|gif|jpeg|css|swf|js|woff)$ {            access_log off;            gzip_static on;            gzip_comp_level 5;            expires 1d;            add_header Cache-Control private;            try_files $uri @proxy;        }        location @proxy {            proxy_pass http://localhost:3000;        }        location ~ {            proxy_pass http://localhost:3000;        }
        error_page 404 /404.html;            location = /40x.html {        }        error_page 500 502 503 504 /50x.html;            location = /50x.html {        }    }
雰囲気がもうカッコいいですね
最初のログインアカウントは admin /admin になってて最初のログインを行うと
パスワード変更を求められます
認証系のドキュメントをご参照ください
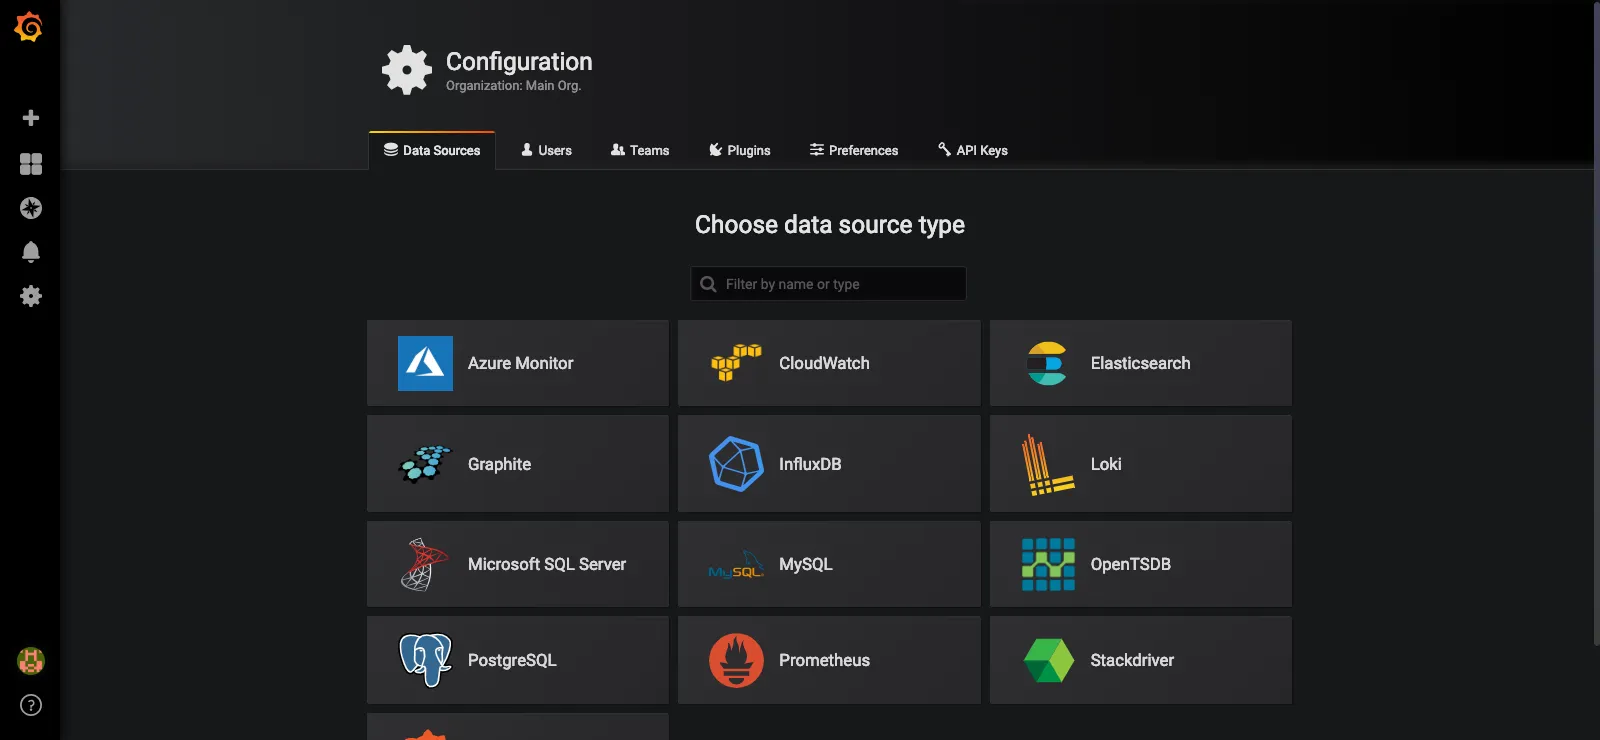
まずは DataSource の選択を求められるのでもちろんPrometheusを選びます
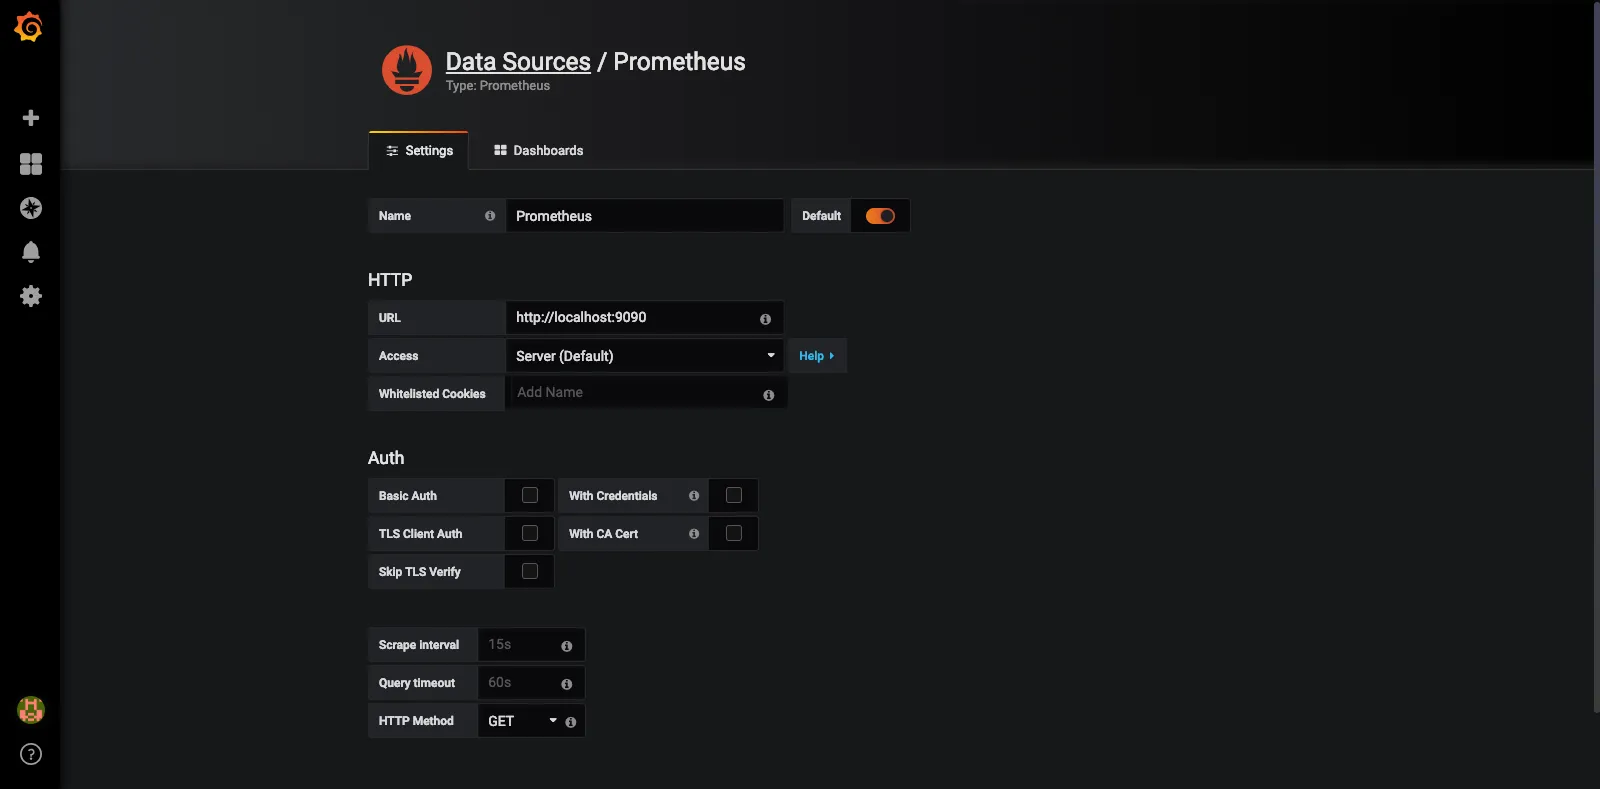
Prometheusは前回 localhost:9000に立ててたので指定すると連携が開始されます
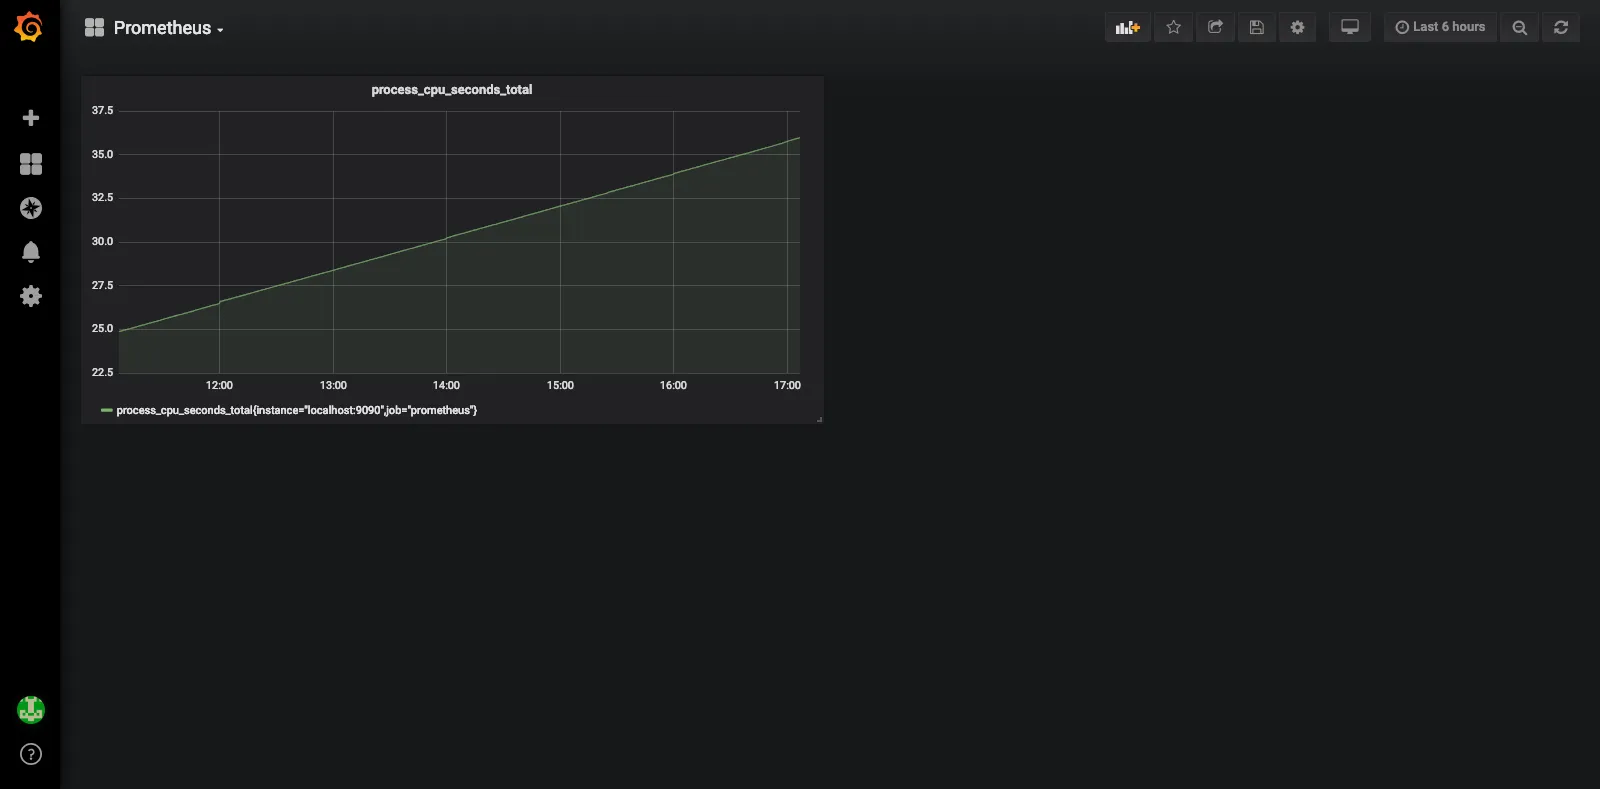
Dashboardの作成すれば可視化出来る様になります
この設定部分は別途Blog書こうと思います
ひとまず利用できる様になったので
めでたしめでたし