Prometheus + fluentd on Amazon Linux2
2 min read
手元にPrometheusの環境が欲しくなったので、
Amazon Linux2にPrometheusを構築する手順をまとめます
構成
- Amazon Linux2
- Prometheus 2.8.0
- fluentd 1.3.3
Prometheus,fluentdは同じサーバーに構築します
2019-03-16時点での手順を元に構築します
情報が古くなっている場合は適宜確認しながら構築してください
Prometheus インストール
ダウンロードページ からPrometheusをダウンロードして解凍します
$ wget https://github.com/prometheus/prometheus/releases/download/v2.8.0/prometheus-2.8.0.linux-amd64.tar.gz$ tar xvfz prometheus-2.8.0.linux-amd64.tar.gz$ cd prometheus-2.8.0.linux-amd64/バイナリ起動するだけでとりあえず動きはします
デフォルトでは9090PortをBindしますので、EC2上に構築時は SecurityGroup に気をつけてください
./prometheus簡単すぎますね OSSは導入難易度の低さは非常に重要な要素だと再認識
fluentd インストール
Installing and Updating the Treasure Data CLI
CLIで一発です
$ curl -L https://toolbelt.treasuredata.com/sh/install-amazon2-td-agent3.sh | shPrometheusと連携させる為に、fluent-plugin-prometheusをインストールします
$ sudo td-agent-gem install fluent-plugin-prometheus簡単すぎますね OSSは導入難易度(ry
Prometheus fluentd 連携
td-agentにMetrics取得用のendpointを設定
$ sudo vim /etc/td-agent/td-agent.conf<source> @type prometheus bind 0.0.0.0 port 24231 metrics_path /metrics</source><source> @type prometheus_monitor interval 10 <labels> hostname ${hostname} </labels></source><source> @type prometheus_output_monitor interval 10 <labels> hostname ${hostname} </labels></source><source> @type prometheus_tail_monitor interval 10 <labels> hostname ${hostname} </labels></source>td-agentの再起動
$ systemctl restart td-agent.servicePrometheus に td-agentが提供するendpointを監視する設定を追加
Node exporterを監視する様に scrape_configs に記述します
scrape_configs:
  〜省略〜
  - job_name: 'fluentd'    static_configs:      - targets: ['localhost:24231']
Prometheus daemon化
systemctl 用の設定を作成します
$ sudo vim /usr/lib/systemd/system/prometheus.service[Unit]Description=PrometheusDocumentation=https://prometheus.io/docs/introduction/overview/After=network-online.targetAfter=td-agent.serviceRequires=td-agent.service
[Service]Type=simpleExecStart=/usr/local/src/prometheus/prometheus \ --config.file=/usr/local/src/prometheus/prometheus.ymlRestart=alwaysExecReload=/bin/kill -HUP $MAINPID
[Install]WantedBy=multi-user.target自動起動設定と実際の起動
$ sudo systemctl daemon-reload$ sudo systemctl enable prometheus.service$ sudo systemctl start prometheus.serviceついでにtd-agent.serviceも自動起動設定
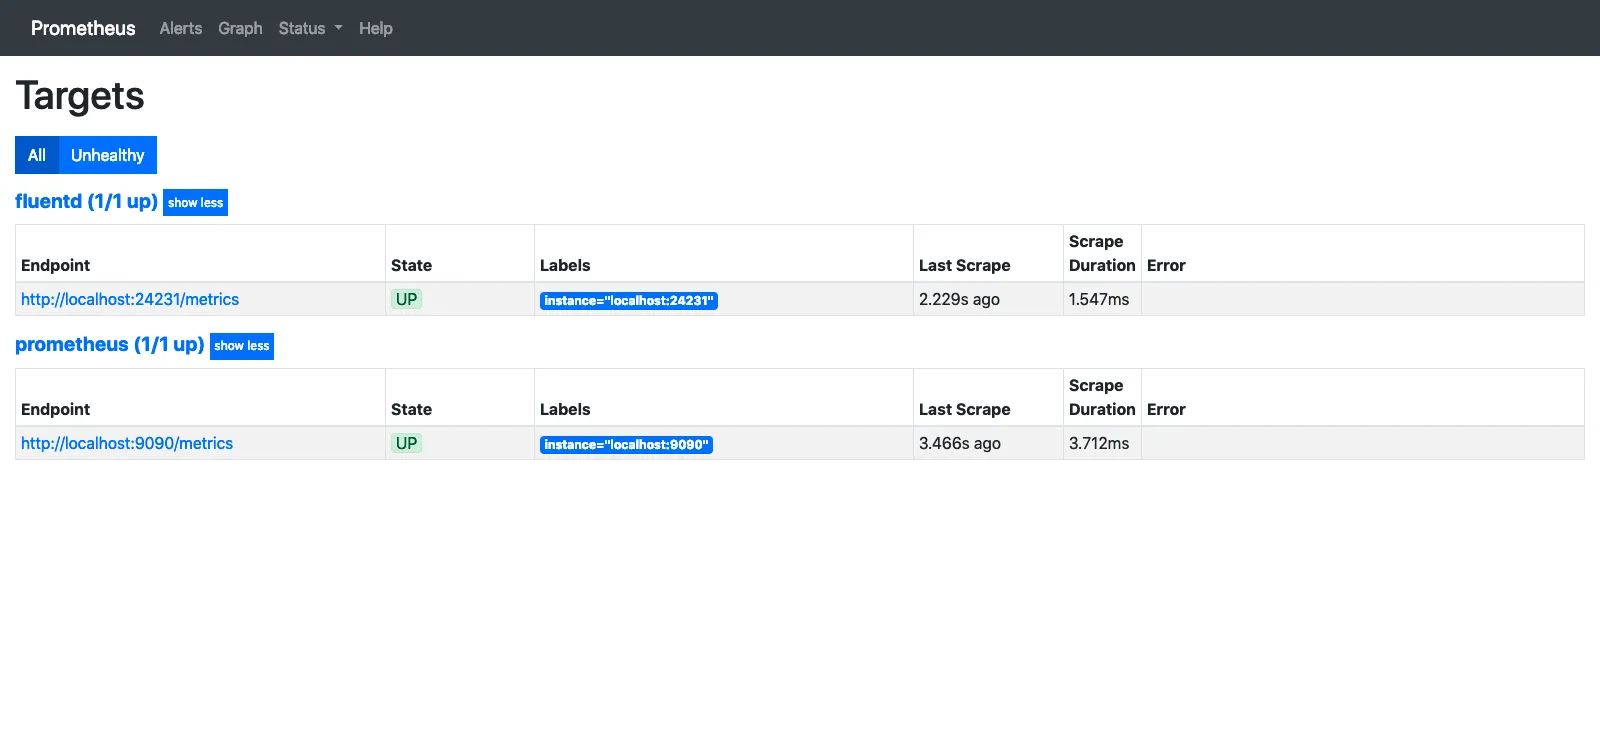
$ sudo systemctl enable td-agent.serviceTargetsに認識されました
 次回はGrafanaで可視化する流れを書きたいと思います